By Brian Brock
The New Franklin Register has been chronicling the sale of real property in Franklin for almost a decade, totaling over 350 sales. We have compiled all these by year and posted them on the Franklin Local website. This database allows us to look back at the recent history of real estate in our town.
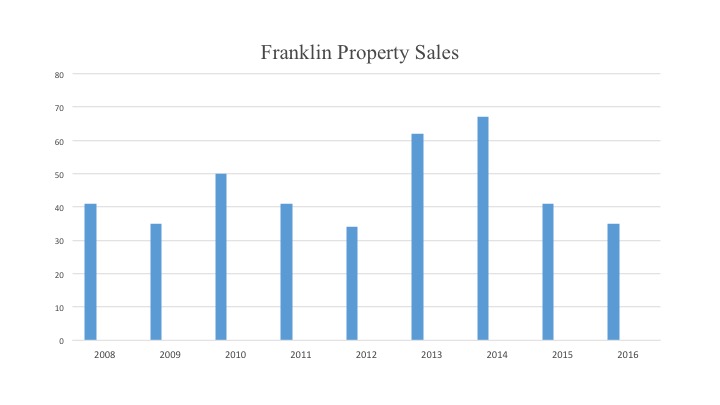
In a typical year, there are forty or so free-market sales – averaging less than one a week. Of the 2,180 parcels in Franklin, that is a two percent turnover annually. Also, there are as many transfers and adjustments, for which no money changes hands. Generally, we do not publish those, to save space. In addition, every month there are a few sales between relatives or of foreclosed parcels, which usually do not yield a free-market price. While we publish those, they are not included in this analysis.
The market for real property was unusually active in 2013 and 2014, with over sixty sales each year. Back then, the market was recovered from the bursting of the housing bubble, and the economy was recovering from the resulting great recession.
In Franklin, most of those sales were for less than $100,000 and almost all were for less than $150,000. In any year, four or fewer sales were for over $200,000.
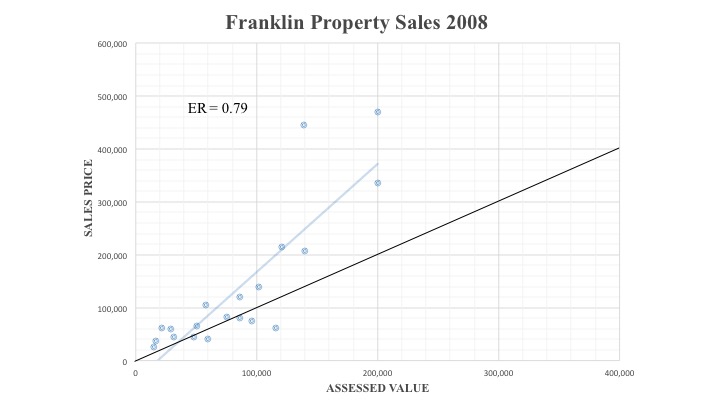
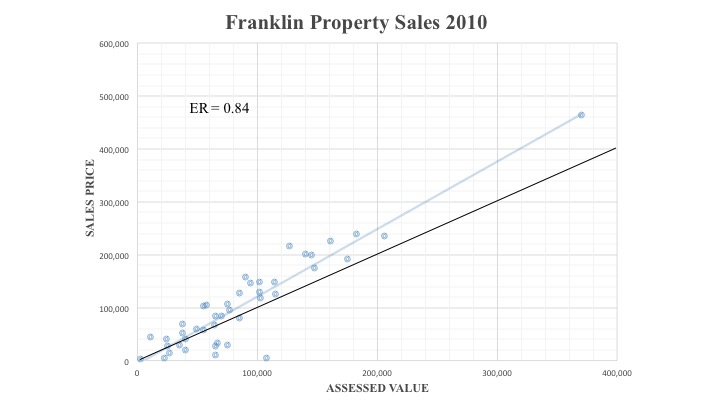
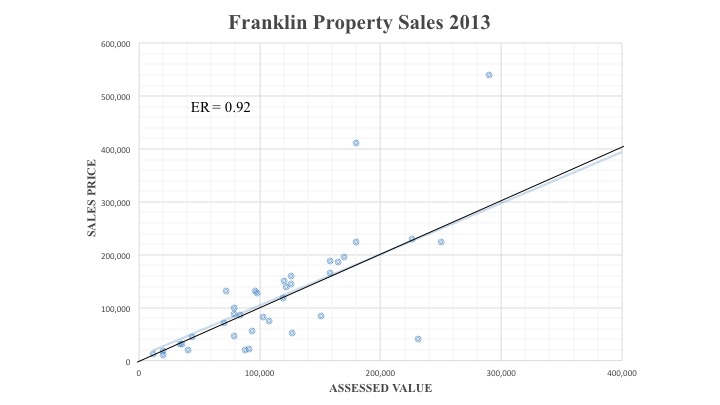
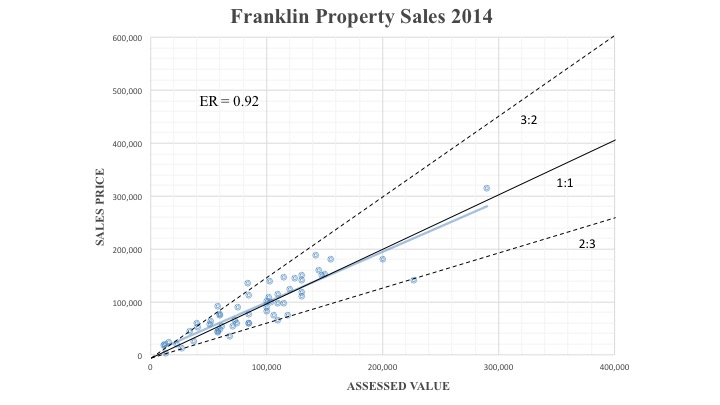
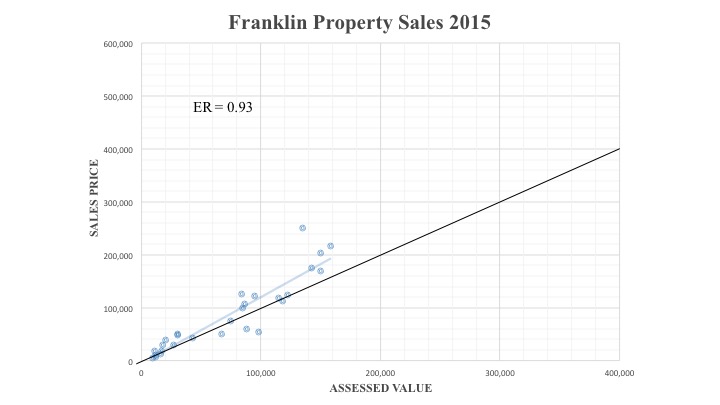
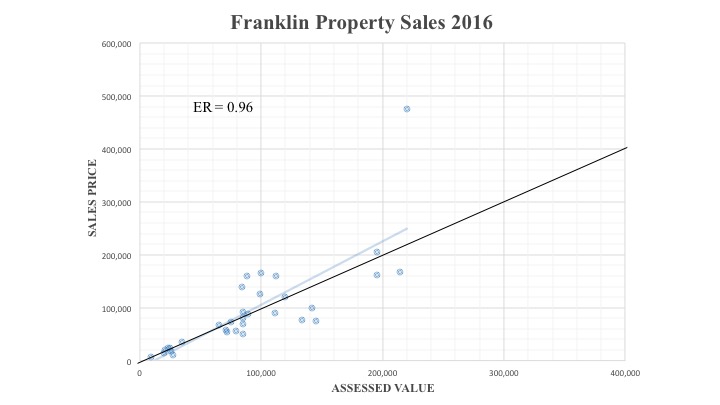
Since late 2008, we have been publishing the assessed values as well. The accompanying graphs show how assessed values compare to sales prices in some recent years. The thin black line up the middle is where value equals price, the ideal situation for assessments, at least according to ORPS.
The New York State Office of Real Property Services estimates how closely a town’s assessments come to this ideal. Their estimation is called the equalization rate (ER) because it is used to equalize property tax rates between towns. When value equals price, the rate is 100 percent. The more undervalued the properties are, the lower the percentage is and the farther away the sales will plot from the ideal line.
Above this line, prices were higher than values, and the farther above, the more those properties were under-assessed or oversold. Nice for the landowners when they are either paying lower taxes or selling for more. (However buyers can use a low assessment to negotiate a lower price.) Not surprisingly, most properties are assessed above this line.
This is true for most towns in Delaware County. ORPS estimated that last year only six of the nineteen Delaware County towns assessed their properties at 100 percent of market value. For the rest, values diverge from prices to a much greater degree than in Franklin. Half have ERs below thirty-three percent, less than one third of market value. In the southwestern corner of the county, three towns are assessed at or below ten percent.
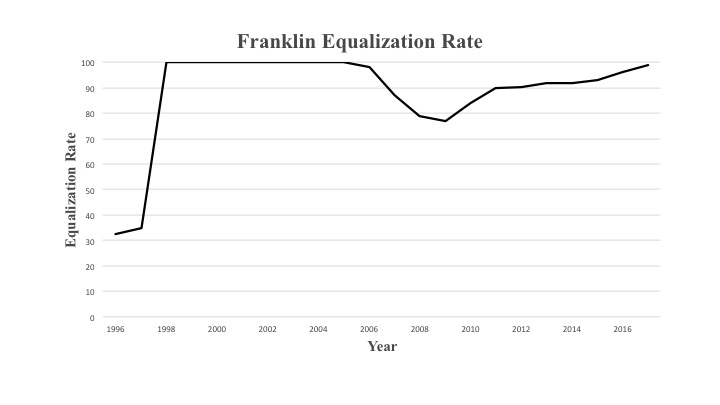
Twenty years ago, the equalization rate in Franklin had fallen to thirty-two percent. A town-wide reassessment brought the ER up to 100 percent, and annual reassessments held it there for nearly a decade. Since 1999, ORPS has paid towns an incentive to keep their ER up, including Franklin.
By 2005, the combination of the high ER and the housing bubble resulted in markedly higher assessments. Many property owners felt that this was inflating their property taxes, even though it is the tax levy (set by the town board) that determines the amount collected. More important, because Franklin pioneered annual reassessments in Delaware County, this increased our share of the county tax bill. The ER for Franklin was allowed to decline during the next few years down to seventy-seven percent by 2009. With the end of annual reassessments to 100 percent, Franklin was no longer paid the ORPS incentive.
Since 2009, the rate has been gradually climbing and reached ninety-nine percent this year. All the sales data that we have published come from this time period.
Because equalization rates are calculated from previous sales, they reflect the assessments of one or more years ago. For example, the rate of ninety-six percent in 2016 is calculated from the sales in 2014. The higher the ER, the closer the trend line (gray line) for the data comes to the ideal line of 1:1, which is what we see in the four graphs.
New York Real Property Law requires that all properties in a town be assessed at the same percentage of market value, although not necessarily 100 percent. If so, then all sales would graph on a single line. But assessments are an estimate, and sales scatter about a line. Even when a town is assessed at an ER of 100 percent, assessments are an imprecise measure of sales price.
Just how imprecise is shown in the graph for the year 2014. There dashed lines show that most sales prices fell between two thirds and one and one half the assessed values.
For each town, individual assessments should aim to equably value each property so that each owner pays his or her fair share of property taxes. The greater the scatter of sales about the trend line, the greater the inequity in taxes paid.
Two recent sales of under-assessed properties stand out and have been excluded from our analysis.
The Quickway gas station and convenience store was sold by J. Mirabito & Sons, Inc. to SCF Capital LLC. (This sale was covered in our fall issue, Mirabito Sells but Stays.) The assessed value was $260,000, but last August the sale price was $1,313,605, an underassessment of five times. This assessment was based on the value of the real property alone, separate from the value of the business.
The vacant Kellogg school building was sold by OSP Capital LLC to American Ginseng Pharm Regional Center LLC. The assessed value was $150,000, but last November the sale price was $975,000, an underassessment of six and a half times. This assessment was based on the prior use of the property.
Given the small number of comparable sales in Franklin and the surrounding towns, the precision in assessing individual sales is about as good as can be reasonably expected. There is room to discuss other topics such as the exemptions from property taxes. The New Franklin Register will continue to provide the data to inform the discussion.

